Devpost
Participate in our public hackathons
Devpost for Teams
Access your company's private hackathons
Grow your developer ecosystem and promote your platform
Drive innovation, collaboration, and retention within your organization
By use case
Blog
Insights into hackathon planning and participation
Customer stories
Inspiration from peers and other industry leaders
Planning guides
Best practices for planning online and in-person hackathons
Webinars & events
Upcoming events and on-demand recordings
Help desk
Common questions and support documentation
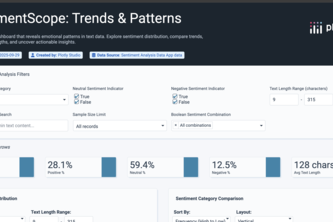
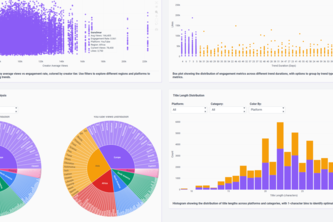
An interactive dashboard that reveals emotional patterns in text data. Explore sentiment distribution, compare trends, analyze word lengths, and uncover actionable insights.
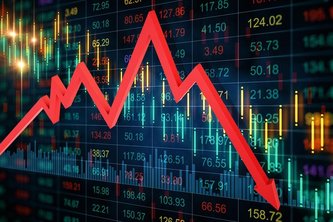
Interactive Plotly app of 62 global stocks (2000–2025). Explore trends, compare performance, and analyze long-term investment patterns with dynamic charts.
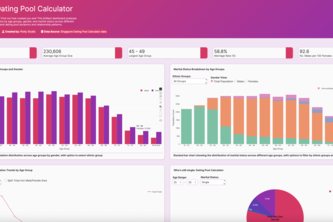
Haven't found a bf/gf yet? This brilliant dashboard analyzes Singapore's population demographics to help YOU understand dating pool dynamics and relationship patterns.
Instead of drowning in spreadsheets to comment on a student's performance, you get clear, interactive dashboards that reveal trends, strengths, and areas that affect their grades.
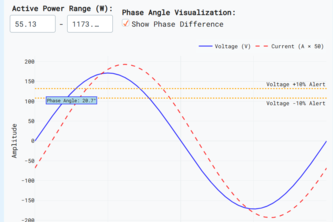
Analyze with Plotly & SensorWatts Data, a Tool for the STEM Academic Lab
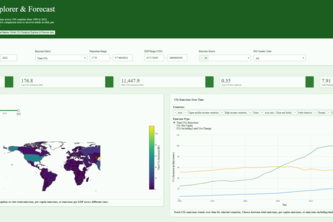
CO₂ Emissions, Deconstructed: Global Trends, Granular Data, Future Forecasts.
Not all bias is loud-some whispers. This dashboard helps you hear it.
Global Social Media Trends Analytics for YouTube & TikTok
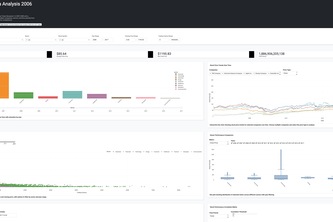
Stock Sector Performance around the Great Recession
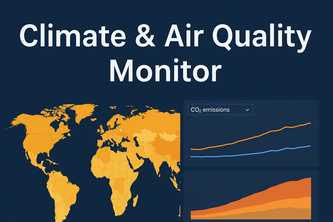
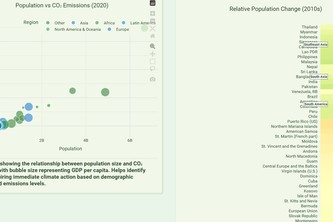
An interactive dashboard to track global CO₂ emissions and air quality trends, compare countries, and uncover insights on how environmental conditions evolve across time and regions.
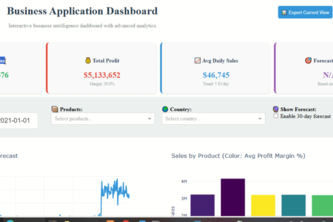
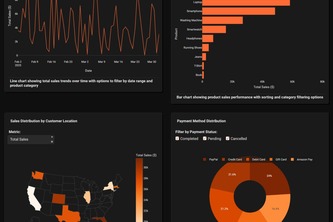
Monitor sales performance, analyze trends, and identify opportunities
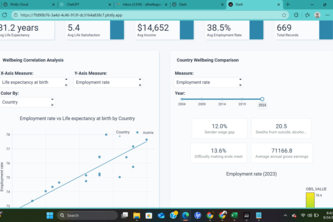
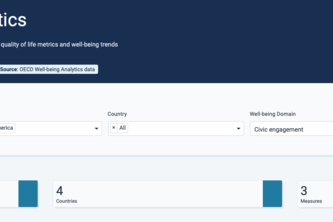
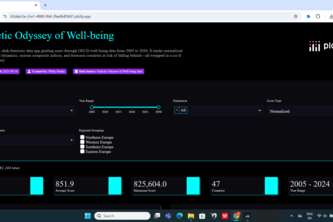
Interactive dashboard to explore life expectancy, income, employment, and life satisfaction across OECD countries with filters, charts, and insights.
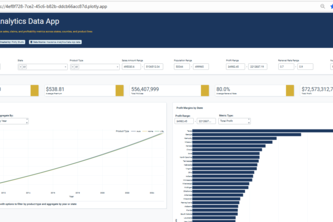
Create synthetic data and demonstrate the power of Plotly Studio
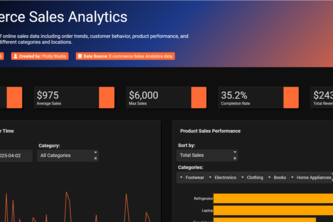
Comprehensive analysis of online sales data including order trends, customer behavior, product performance, and payment patterns across different categories and locations.
Interactive exploration of OECD Better Life Index indicators to analyze quality of life metrics and well-being trends globally.
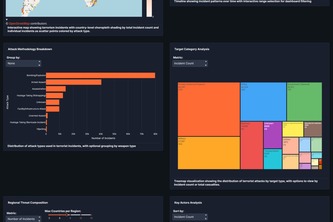
Explore decades of global conflict. An interactive dashboard transforming complex terrorism data into clear, actionable insights on patterns, hotspots, and trends.
End-to-end analysis of superstore performance
Climate change feels global, but its story is local. From global averages to your neighbourhood: visualise the real impact of climate change with data-driven insights.
Navigate the cosmos of global well-being—from 2005’s baseline insights to 2030’s forecasts. Charting humanity’s well-being across time and space.
121 – 140 of 140